
Your application is slow and you have narrowed it down to latency, but you are not sure which layer is causing it. Before you start swapping instance types or throwing money at a CDN, you need 10 minutes with a distributed trace to figure out where those milliseconds are actually going. Here are the fixes that move the needle — ranked by effort and impact — without requiring you to re-architect anything.
Where Latency Actually Comes From in Cloud Applications
Cloud application latency breaks into three buckets, and most optimization content treats them as one problem. They are not.
Network transit time — the round trip from the client to your server and back. For a user on the US West Coast hitting an origin in us-east-1, this is 60 to 80 milliseconds just for the network hop. Add TLS handshake overhead and you are at 100 to 150 milliseconds before your application processes a single byte.
Application processing time — compute and memory. How long your code takes to execute business logic, serialize a response, and push it to the network buffer. This varies wildly by language, framework, and how many unnecessary things your middleware chain does on every request.
Storage I/O time — database queries, file reads, cache lookups. For most web applications, this is the largest contributor to P99 latency. A single unindexed query on a 10-million-row table can add 500 milliseconds that no amount of CDN tuning will fix.
Start with a distributed trace. AWS X-Ray, Datadog APM, or OpenTelemetry will break your P99 latency into these three buckets. Optimizing the wrong layer wastes time and money. I have watched teams spend two weeks tuning their CDN configuration when 80% of their latency was a missing database index.
CDN Placement: The Fastest Win for Most Applications
A CDN cache hit serves content from an edge location in roughly 20 milliseconds. A cache miss that falls through to your origin in us-east-1 costs 150 to 300 milliseconds for a user on the US West Coast. The math is straightforward: more cache hits means lower average latency.
But having a CDN is not the same as having an effective CDN. A CloudFront distribution with a 40% cache hit ratio is worse than no CDN with an optimized origin — you are paying for the CDN infrastructure while most requests still hit your server. The number that matters is cache hit ratio, not CDN presence.
Three things move cache hit ratio from 40% to 85% or higher. First, set cache-control headers correctly: one year for static assets like images and compiled JavaScript, no-cache for user-specific dynamic content. Second, manage your Vary header — an overly broad Vary header fragments your cache into hundreds of variants that rarely get a hit. Third, enable origin shield, which places an additional caching layer between edge locations and your origin and consolidates cache fills.
The measurable result: moving from 40% to 85% cache hit ratio on a typical API-driven application reduces P95 latency by roughly 60% without touching a single line of application code. That is the fastest win available to most teams.
Database Query Latency: Index Before You Optimize Anything Else
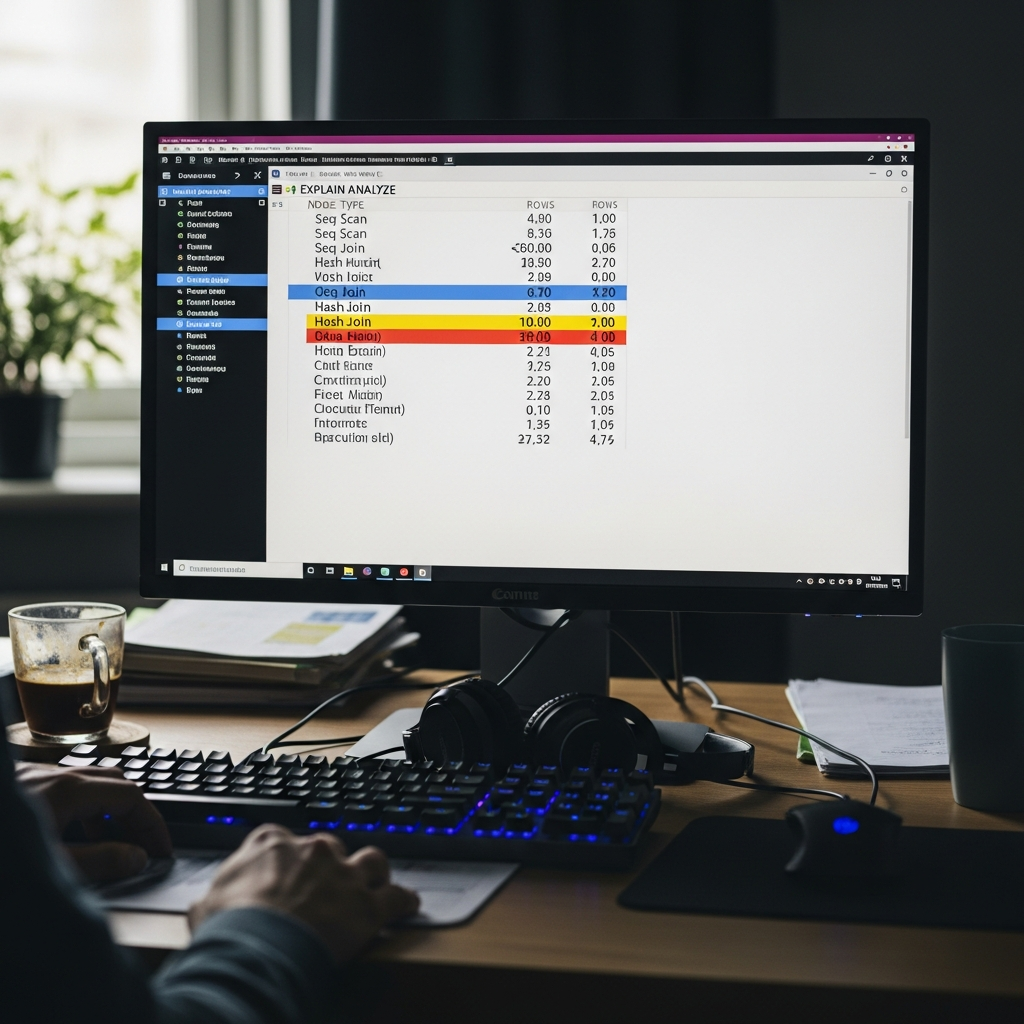
The majority of application latency in production systems is database query time, not network transit. Run EXPLAIN ANALYZE on your slowest queries before touching infrastructure.
Three patterns cause most of the damage. Sequential scans on large tables — your query is reading every row because no index matches the WHERE clause. Missing indexes on foreign key columns — JOIN operations without indexed foreign keys turn O(log n) lookups into O(n) scans. N+1 query patterns — one query per loop iteration instead of a single batch query. An N+1 pattern on a list of 100 items generates 101 database round trips at 2 to 5 milliseconds each. That is 200 to 500 milliseconds of latency that looks like a slow application but is actually a slow query pattern.
On the infrastructure side, EBS volume type matters more than most engineers realize. gp3 provides 3,000 IOPS and 125 MB/s throughput baseline at lower cost than gp2, with consistent performance that does not depend on burst credits. For high-frequency OLTP workloads, io2 Block Express delivers up to 64,000 IOPS. If your RDS instance is on gp2 and you are seeing periodic latency spikes, check whether your burst credit balance is hitting zero — that is gp2 throttling to baseline, not a database problem.
One more: RDS storage autoscaling can cause brief latency spikes during expansion events. Pre-provision storage on production databases to avoid surprise resizing during peak traffic.
gRPC vs REST: When the Protocol Switch Is Worth It
gRPC uses HTTP/2 multiplexing and Protocol Buffers binary serialization. On the same endpoint, measured improvement over REST with JSON: 30 to 50% latency reduction and 60 to 80% payload size reduction for data-heavy responses. Those numbers are real and reproducible.
Not every API should switch. gRPC is not worth the migration cost for simple CRUD endpoints or when your clients are web browsers — gRPC-Web adds a proxy layer that partially negates the latency benefit. The switch pays off for microservice-to-microservice communication where both ends are backend services, high-frequency API calls exceeding 100 requests per second per instance, and data pipelines with large response payloads where JSON serialization overhead becomes measurable.
The hidden cost: gRPC requires protobuf schema definitions upfront and ongoing schema maintenance. For a team of three engineers with 5 API endpoints, that overhead is not justified by a 30% latency improvement. For a team running 50 microservices at scale, the protocol standardization alone is worth the migration.
DNS and Connection Management
These are the optimizations that individually save 20 to 100 milliseconds but compound across every request.
DNS TTL. Long TTLs at 3,600 seconds or more reduce resolver lookup time on repeated requests but slow DNS propagation during deployments and failover events. Use low TTL at 30 to 60 seconds during migration windows, then increase to 300 or 600 seconds for steady state. The latency saving per request is small — 1 to 5 milliseconds — but DNS resolution happens before anything else in the request lifecycle.
Connection pooling. Each new database connection costs 20 to 50 milliseconds including TCP handshake and authentication. For traditional application servers, a connection pool reuses existing connections. For serverless architectures, every Lambda invocation creates a new connection by default. RDS Proxy adds connection pooling for Lambda and reduces database connection overhead by 60 to 70%. If you are running Lambda-to-RDS and not using RDS Proxy, you are paying 20 to 50 milliseconds of unnecessary latency on every cold invocation.
TCP keepalive. Idle connections eventually close, and the next request pays the TLS handshake cost again — roughly 100 milliseconds for a full TLS 1.3 handshake. Configure keepalive at both the OS level and the application level to maintain idle connections. The cost is negligible memory usage for keeping the connection open. The savings are 100 milliseconds on what would have been a reconnection.
None of these fixes individually transform your application’s performance. Together, they remove 100 to 300 milliseconds of overhead that accumulates across every request your users make. Start with the distributed trace, fix the biggest bucket first, and work down.


Stay in the loop
Get the latest multicloud hosting updates delivered to your inbox.